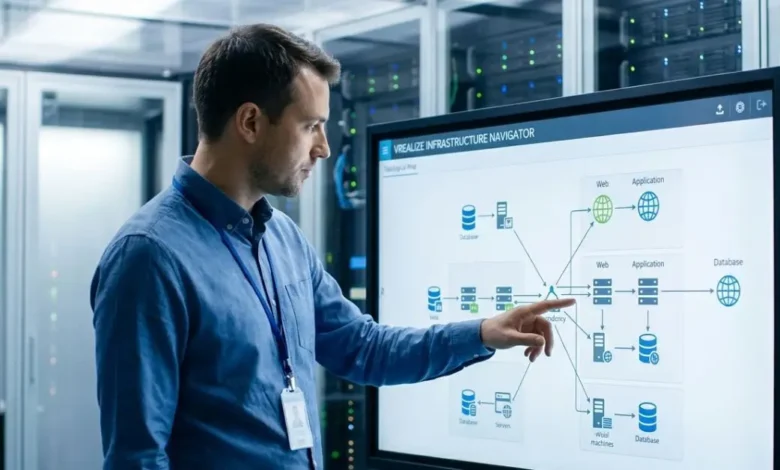
Modern data centers are sprawling webs of servers, applications, and network paths that few administrators can trace by memory alone, and that is exactly the gap vRealize Infrastructure Navigator was built to close. Born out of VMware’s push to give IT teams real visibility into their virtualized environments, this tool automatically discovers application dependencies and maps relationships that would otherwise take weeks to document manually.
For any organization running complex virtual infrastructure, understanding how workloads connect is no longer optional; it is a survival skill. This article walks through what the tool does, how it works, and why it still matters for teams managing intricate hybrid environments today.
What Is vRealize Infrastructure Navigator
vRealize Infrastructure Navigator is a discovery and mapping solution originally developed by VMware to help administrators visualize the relationships between applications, servers, and network components inside a virtualized data center. Rather than relying on spreadsheets or tribal knowledge passed between engineers, the platform automatically scans running workloads and builds a live picture of how everything connects.
This automated approach removes much of the guesswork that traditionally plagued infrastructure teams trying to understand which services depend on which backend systems. It was designed specifically to work alongside vCenter Server, pulling in inventory data and layering application-level intelligence on top of the virtual machine metadata already being collected.
The tool’s core purpose is to answer a deceptively simple question: what happens if I touch this server? Before any patch, migration, or decommission, administrators need to know exactly which applications and dependent services will be affected.
Infrastructure Navigator answers that question by continuously monitoring network traffic and process activity across hosts, then translating raw data into readable dependency maps. Teams that once spent days interviewing application owners could instead pull up a visual diagram showing every upstream and downstream connection in minutes. That shift from manual documentation to automated discovery is the single biggest reason the platform earned a lasting reputation among VMware administrators.
Will You Check This Article: Oncepik: The Rising All-in-One Productivity Platform
How It Discovers and Maps Your Data Center
The discovery engine behind this tool works by deploying lightweight collector appliances throughout the environment, which passively observe network flows between virtual machines without requiring agents installed on every guest operating system.
This agentless approach was a deliberate design choice, since agent-based monitoring tools often introduce performance overhead and require constant maintenance across hundreds or thousands of endpoints. Instead, the collectors watch TCP connections, correlate source and destination addresses with known inventory, and build a relationship graph that updates continuously as workloads change. The result is a living map rather than a static snapshot that goes stale the moment something is reconfigured.
Once data collection begins, the mapping process layers additional context onto raw network observations, including process names, listening ports, and service identifiers pulled from the operating systems themselves when credentials are provided. This deeper visibility allows the tool to distinguish between, for example, a database server talking to a web front end versus incidental background traffic that has nothing to do with a specific application stack.
Administrators can then filter views by application, tier, or business service to isolate exactly the dependency chain they need to examine. Because the discovery process runs continuously, any new virtual machine added to the environment gets automatically incorporated into the topology without manual intervention, keeping documentation accurate over time.
Key Features That Simplify IT Operations
One of the standout capabilities is real-time relationship visualization, which presents dependency data as interactive diagrams rather than raw tables of IP addresses and ports. Administrators can click into any node on the map to drill down into supporting details, such as which processes are generating traffic or how long a particular connection has been active.
This visual-first approach makes it far easier for non-network specialists, including application owners and service desk staff, to understand infrastructure relationships without needing deep packet-level expertise. Search and filtering tools let users narrow enormous environments down to a single business application in seconds, which is invaluable during incident response.
Another important feature set involves historical tracking and change detection, allowing teams to compare the current state of an application’s dependencies against a previous baseline. When something breaks unexpectedly, being able to see exactly what changed in the network topology over the past days or weeks often points directly to the root cause.
The platform also supports tagging and grouping of virtual machines into logical application containers, which makes reporting far more meaningful than looking at isolated servers in a vacuum. Combined, these capabilities turn what used to be reactive troubleshooting into a more proactive, evidence-based operational practice.
Application Dependency Mapping Explained
Application dependency mapping is the practical output that most teams care about, and it represents the translation of raw network telemetry into something an IT manager can actually use for planning. Instead of a flat list of servers, the tool groups related virtual machines into application tiers, showing web layers, application layers, and database layers as distinct but connected components.
This tiered view mirrors how most enterprise applications are actually architected, making it intuitive for teams to understand impact radius before making any infrastructure change. It also helps uncover undocumented or forgotten dependencies that accumulate naturally over years of ad hoc changes and staff turnover.
Beyond simple visualization, dependency mapping data feeds directly into risk assessment for maintenance windows, disaster recovery planning, and cloud migration projects. When an organization is deciding which applications to move first during a migration, knowing the full dependency chain prevents the common mistake of relocating a front-end server while leaving its database behind on the old platform. Migration teams routinely rely on this kind of mapping to sequence moves correctly and avoid unplanned outages. The same data also supports capacity planning conversations, since understanding traffic patterns between tiers helps size network bandwidth and storage requirements more accurately for future infrastructure investments.
Benefits for Change Management and Troubleshooting
Change management processes benefit enormously from having accurate, automatically maintained dependency data available before any request for change is approved. Change advisory boards can review a real topology diagram instead of relying on an engineer’s best guess about what a proposed change might affect.
This reduces the frequency of surprise outages caused by touching a server that turned out to be more connected than anyone realized. Over time, organizations that adopt this kind of discovery tooling report fewer emergency changes and a smoother, more predictable release cadence across their environments.
During active incidents, the value becomes even more apparent, since responders can immediately pull up the affected application’s dependency map rather than starting an investigation from scratch. Seeing which upstream services feed into a failing component often narrows the list of likely causes within minutes rather than hours.
This speed matters enormously when downtime carries direct financial or reputational cost. Post-incident reviews also improve, because teams can reference the exact state of the topology at the time of the outage, giving a factual foundation for root cause analysis rather than relying on memory or incomplete logs gathered after the fact.
Integration with the Broader VMware Ecosystem
This discovery platform was never meant to operate in isolation; it was designed to complement other tools within the broader virtualization management suite. Data collected here has historically fed into configuration management databases and IT service management platforms, enriching records that would otherwise rely on manual updates.
That integration meant service desk tickets could automatically include relevant dependency context, speeding up triage for support staff who might not have deep familiarity with every application in the portfolio. Linking discovery data to ticketing systems closed a long-standing gap between infrastructure monitoring and day-to-day operational workflows.
The tool also aligned closely with capacity and performance management components of the same software family, allowing administrators to correlate dependency data with resource utilization trends. Seeing that a heavily connected database server is also running close to CPU or memory limits gives a much clearer picture of risk than either data set alone.
Over the years, VMware has folded much of this discovery functionality into newer unified management platforms, reflecting a broader industry trend toward consolidated observability rather than standalone point tools. Organizations still running legacy versions often plan their upgrade paths with this consolidation in mind, since it affects long-term licensing and support considerations.
Best Practices for Deployment and Configuration
Successful deployment starts with proper sizing of collector appliances relative to the scale of the environment being monitored, since undersized collectors can miss traffic spikes and produce incomplete dependency maps. Administrators should place collectors strategically across network segments to ensure visibility into east-west traffic between virtual machines, not just north-south traffic crossing the perimeter firewall. Providing guest operating system credentials where policy allows significantly improves the quality of discovered data, since process-level detail cannot be inferred from network flow alone. Skipping this step often leaves teams with a topology that shows connections but lacks the context needed to act on them confidently.
Ongoing maintenance matters just as much as initial setup, since environments change constantly and stale credentials or decommissioned collectors quickly degrade data accuracy. Regularly reviewing tagging conventions and application groupings keeps the dependency views meaningful rather than cluttered with generic, unlabeled servers. Many teams schedule periodic audits comparing the discovered topology against known application inventories to catch drift early.
Training staff across networking, application support, and change management teams to actually use the visualization tools, rather than treating them as a niche network engineering resource, ensures the investment pays off across the whole organization rather than sitting underused by a small group of specialists.
Conclusion
vRealize Infrastructure Navigator represents a practical answer to one of the most persistent challenges in enterprise .IT truly understanding how applications and infrastructure connect beneath the surface. By automating discovery, visualizing dependencies, and feeding accurate data into change management and troubleshooting workflows, it turns guesswork into evidence-based decision making.
Organizations that rely on this kind of dependency mapping tend to experience fewer unplanned outages, faster incident resolution, and smoother migration projects because they can see the full picture before acting. While VMware’s product lineup has evolved and much of this functionality now lives within broader management suites, the underlying discipline the tool introduced remains just as relevant. For any team managing a complex virtual environment, investing in clear application dependency visibility, whether through this platform or its modern successors, continues to pay dividends in reduced risk and operational confidence.
Read More: Mynewsdaily.co.uk